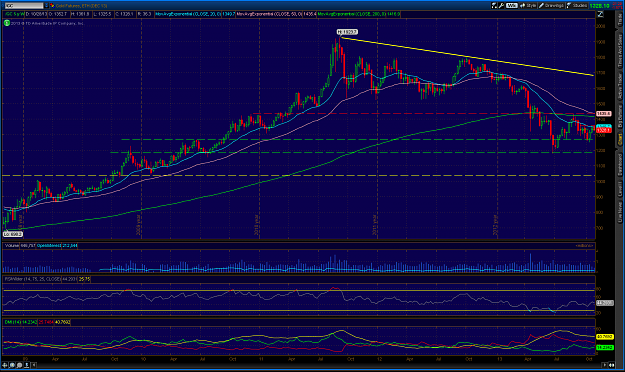
Attached Image (click to enlarge)
Above chart shows overall views of market.
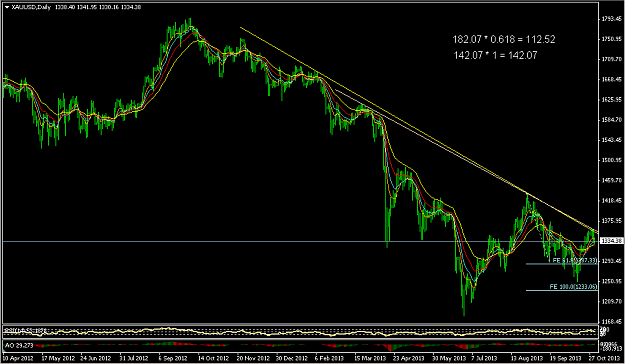
Attached Image (click to enlarge)
Above 2nd chart shows that market test resistance line and further fall for 5th downside wave after finishing A-B-C pattern of 4th wave
according to Elliott Wave theory, there are two ways to determine a target of finishing 5th wave.
1st way: take start point of 1st wave (1433.61) and end point of 3rd wave (1251.54), make difference of them (182.07) and multiply with Fibonacci number 0.618, subtract resulting value from end point of 4th wave (1361.70). Resulting value is either target.
1433.61 - 1251.54 = 182.07 * 0.618 = 112.52
1361.70 - 112.52 = 1249.18 ( EITHER TARGET)
2nd way: take start point of 1st way )1433.61) and end wave of 1st wave (1291.54), make difference of them (142.07) and multiply with Fibonacci number 1, subtract resulting value from end point of 4th wave (1361.7). Resulting value is either target.
1433.61 - 1291.54 = 142.07 * 1 = 142.07
1361.70 - 142.07 = 1219.63 (EITHER TARGET)
And there is also possibility that target can in between of EITHER TARGET VALUE. (1219 to 1249)
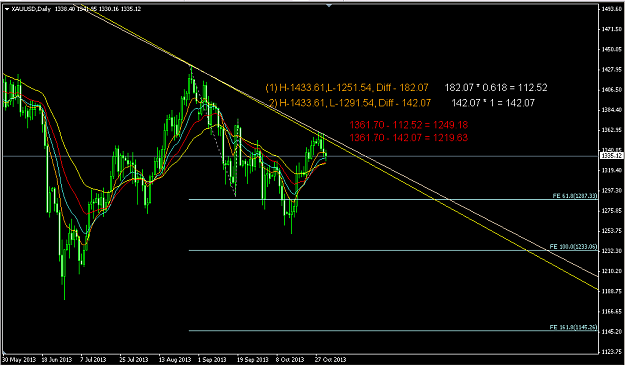
Attached Image (click to enlarge)
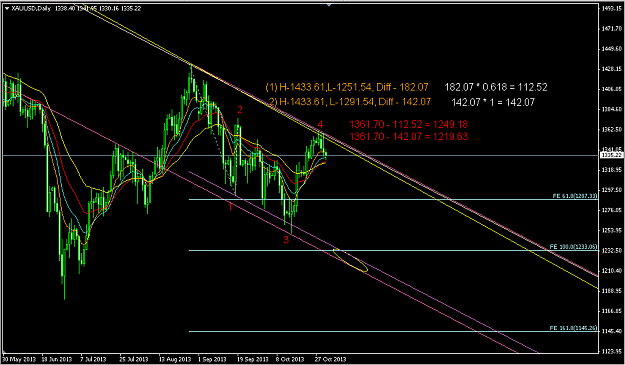
Above chart shows target area..
I have no personal position in forex and still well learning it. But very well implement in Indian equity market.
suggestion accepted....