
US Business Inventories m/m
It's a signal of future business spending because companies are more likely to purchase goods once they have depleted inventories;
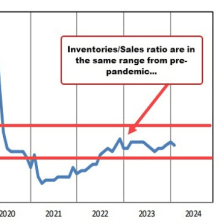
- US Business Inventories m/m Graph
- History
| Expected Impact / Date | Actual | Forecast | Previous |
|---|---|---|---|
| Jun 18, 2024 | 0.3% | 0.3% | -0.1% |
| May 15, 2024 | -0.1% | 0.0% | 0.3% |
| Apr 15, 2024 | 0.4% | 0.3% | 0.0% |
| Mar 14, 2024 | 0.0% | 0.2% | 0.3% |
| Feb 15, 2024 | 0.4% | 0.4% | -0.1% |
| Jan 17, 2024 | -0.1% | -0.1% | -0.1% |
| Dec 14, 2023 | -0.1% | 0.0% | 0.2% |
| Nov 15, 2023 | 0.4% | 0.4% | 0.4% |
-
- US Business Inventories m/m News
 From www2.census.gov|Jun 18, 2024
The U.S. Census Bureau announced the following new manufacturing and trade statistics for April 2024: tables The combined value of distributive trade sales and manufacturers’ shipments for April, adjusted for seasonal and trading day differences but not for price changes, was estimated at $1,862.4 billion, up 0.3 percent (±0.2 percent) from March 2024 and was up 2.2 percent (±0.3 percent) from April 2023. Manufacturers’ and trade inventories for April, adjusted for seasonal and trading day differences but not for price changes, ...
 From www2.census.gov|May 15, 2024
The U.S. Census Bureau announced the following new manufacturing and trade statistics for March 2024. The combined value of distributive trade sales and manufacturers’ shipments for March, adjusted for seasonal and trading day differences but not for price changes, was estimated at $1,858.0 billion, down 0.1 percent (±0.2 percent)* from February 2024 and was up 2.1 percent (±0.4 percent) from March 2023. Inventories Manufacturers’ and trade inventories for March, adjusted for seasonal and trading day differences but not for price ...
 From forexlive.com|Apr 15, 2024
US business inventories for Februray 2024 • Prior month unchanged • Business inventories 0.4% vs 0.4% estimate and Unchanged last month • Retail inventories 0.4% vs 0.3% last month (revised from 0.4% previously reported) • Total value of distributive trade sales and manufacturers’ shipments in February was estimated at $1,866.5 billion. • This represents an increase of 1.6% from January 2024 and a 1.0% rise from February 2023. • Manufacturers’ and trade inventories in February were estimated at $2,567.5 billion. • Inventories were up ...
- From www2.census.gov|Mar 14, 2024
The U.S. Census Bureau announced the following new manufacturing and trade statistics for January 2024: tables The combined value of distributive trade sales and manufacturers’ shipments for January, adjusted for seasonal and trading day differences but not for price changes, was estimated at $1,833.3 billion, down 1.3 percent (±0.2 percent) from December 2023 and was down 1.2 percent (±0.4 percent) from January 2023. Manufacturers’ and trade inventories for January, adjusted for seasonal and trading day differences but not for ...
- From www2.census.gov|Feb 15, 2024
Revisions to the Wholesale and Retail adjusted and not adjusted monthly estimates for sales and inventories are tentatively scheduled for release on March 27, 2024, and April 23, 2024, respectively. Estimates will be revised to reflect the results of the 2022 Annual Wholesale and Annual Retail Trade Surveys. Revised historical data from the Manufacturers’ Shipments, Inventories, and Orders (M3) Survey will be issued on May 14, 2024, and these revisions will be based on the results of the annual review of the seasonal adjustment ...
- From www2.census.gov|Jan 17, 2024
The U.S. Census Bureau announced the following new manufacturing and trade statistics for November 2023. The combined value of distributive trade sales and manufacturers’ shipments for November, adjusted for seasonal and trading day differences but not for price changes, was estimated at $1,858.8 billion, up 0.2 percent (±0.1 percent) from October 2023 and was up 1.0 percent (±0.3 percent) from November 2022. Inventories Manufacturers’ and trade inventories for November, adjusted for seasonal and trading day differences but not for ...
- From www2.census.gov|Dec 14, 2023
The U.S. Census Bureau announced the following new manufacturing and trade statistics for October 2023. The combined value of distributive trade sales and manufacturers’ shipments for October, adjusted for seasonal and trading day differences but not for price changes, was estimated at $1,856.2 billion, down 1.0 percent (±0.2 percent) from September 2023 and was down 0.2 percent (±0.3 percent)* from October 2022. Inventories Manufacturers’ and trade inventories for October, adjusted for seasonal and trading day differences but not ...
- From www2.census.gov|Nov 15, 2023
The U.S. Census Bureau announced the following new manufacturing and trade statistics for September 2023. The combined value of distributive trade sales and manufacturers’ shipments for September, adjusted for seasonal and trading day differences but not for price changes, was estimated at $1,879.3 billion, up 1.1 percent (±0.2 percent) from August 2023 and was up 1.6 percent (±0.2 percent) from September 2022. Inventories Manufacturers’ and trade inventories for September, adjusted for seasonal and trading day differences but not ...
| Released on Jun 18, 2024 |
|---|
| Released on May 15, 2024 |
|---|
| Released on Apr 15, 2024 |
|---|
| Released on Mar 14, 2024 |
|---|
| Released on Feb 15, 2024 |
|---|
| Released on Jan 17, 2024 |
|---|
| Released on Dec 14, 2023 |
|---|
| Released on Nov 15, 2023 |
|---|
- Details